At TimberFlow Inc., we've spent decades proudly supplying high-quality timber to businesses that transform raw wood into beautiful, functional products. From furniture makers to flooring contractors, our clients rely on us to be dependable partners. But in recent months, we've noticed an unsettling trend: delayed payments.
As any supplier knows, cash flow is the lifeblood of business. When payments slow down, operations suffer. Yet figuring out why some clients pay on time while others don't is like navigating a maze. We needed a better way to understand our network and the risks hiding within it. So, we turned to something unconventional for the timber business using Neo4j's Graph Data Science.
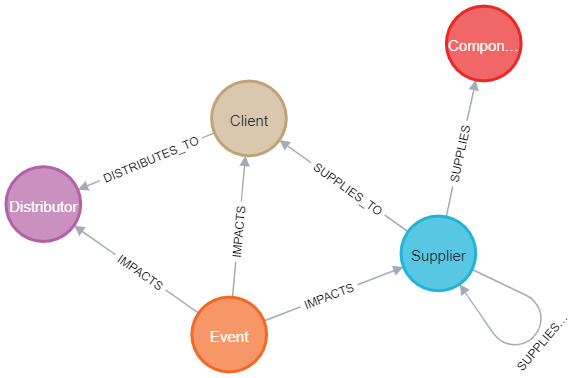
The Web of Dependencies
Our clients don't operate in a vacuum. Take for instance CraftFurn Designs, one of our key clients. They don't only rely on our timber but also on LeatherLux Ltd. for high-quality leather, FoamWorks Co. for foam, and IronBuild Metals for metal frames to build their furniture. Once the products are ready, they're shipped to distributors like HomeNest Retailers who connect them to end customers. Each step is bound by payment terms, contracts, and dependencies.
But the story doesn't stop there. LeatherLux, for example, depends on HideFarm Co. for raw hides, who in turn source from regional farmers. If there's a flood in one of those regions or new tariffs are imposed, LeatherLux can't deliver. CraftFurn Designs' production stalls, and we at TimberFlow Inc. don't get paid.
The complexity was overwhelming, but the graph made it visible.
Uncovering Hidden Communities with Louvain
We wanted to identify those hidden communities whose inner workings impact the entire payment chain. So, we projected the graph and used the Louvain community detection algorithm from Neo4j's Graph Data Science library to discover clusters of highly interconnected entities. The results were revealing.
One name stood out—LeatherLux Ltd. This supplier was the hub of a dense cluster involving multiple clients and upstream suppliers. The graph revealed that LeatherLux was a critical node; any disruption here would ripple across multiple supply chains.
A late delivery or production halt at LeatherLux could stall several clients who then delay payments. Not out of unwillingness, but because they can't complete their products.
Events: The Wild Cards in Payment Behavior
Beyond the obvious supply chain dependencies, we also modeled external events. Things like:
- Chemical Plant Explosion in India which impacted TanninChem Ltd., whose chemicals LeatherLux Ltd. depended upon
- EU Leather Tariff Hike which impacted the supply of leather
- Winter Storm Eliot which impacted the supply of foam to FoamWorks Co., which in turn impacted CraftFurn Designs
These events were tied to the affected suppliers and clients, giving us richer context. Suddenly, past payment behavior wasn't the whole story. An "on-time payer" might miss a cycle due to an upstream flood.
Looking Forward: Machine Learning and Beyond
The possibilities are endless. By diving deeper into this data, we can better understand why payments were delayed, not just that they were. With the graph in place, we can build machine learning pipelines using Neo4j's GDS library. This will help us flag at-risk clients before invoices are overdue, allowing our finance team to act preemptively.
While machine learning can help us get ahead of problems, we can dream bigger. In our next exploration, we'll look into causal inference—understanding what actually causes payment delays—and counterfactual inference, like asking: "What if the chemical plant explosion hadn't occurred?" or "What if LeatherLux had a backup supplier?" These are powerful questions, and graphs help us ask them in meaningful ways.
Stay tuned for more insights from our journey into graph-powered business intelligence.